10.1 Implementation of the Shared Socioeconomic Pathways (SSPs)
This page presents the assumptions taken for the implementation of the Shared Socio-economic Pathways (SSP) in the WITCH model. The SSPs represent 5 different scenarios that have been qualitatively described through story lines and henceforth quantified, see (O’Neill et al. 2015). These scenarios are implemented matching the story lines and quantification throughout the WITCH model to generate the different scenarios. Building on these scenarios, a baseline and four different policy targets have been formulated relying on the RCPs (Representative Concentration Pathways) which consist in four targets on total radiative forcing in 2100 of 2.6, 3.7, 4.5, and 6.0 W/m2. The third dimension of the SSPs consists in a first-best global policy implementation starting immediately versus a second best delayed action policy, which can also differ across regions and is specified differently for each SSP. These different policy architecture are referred to as Shared Policy Assumptions (SPAs).
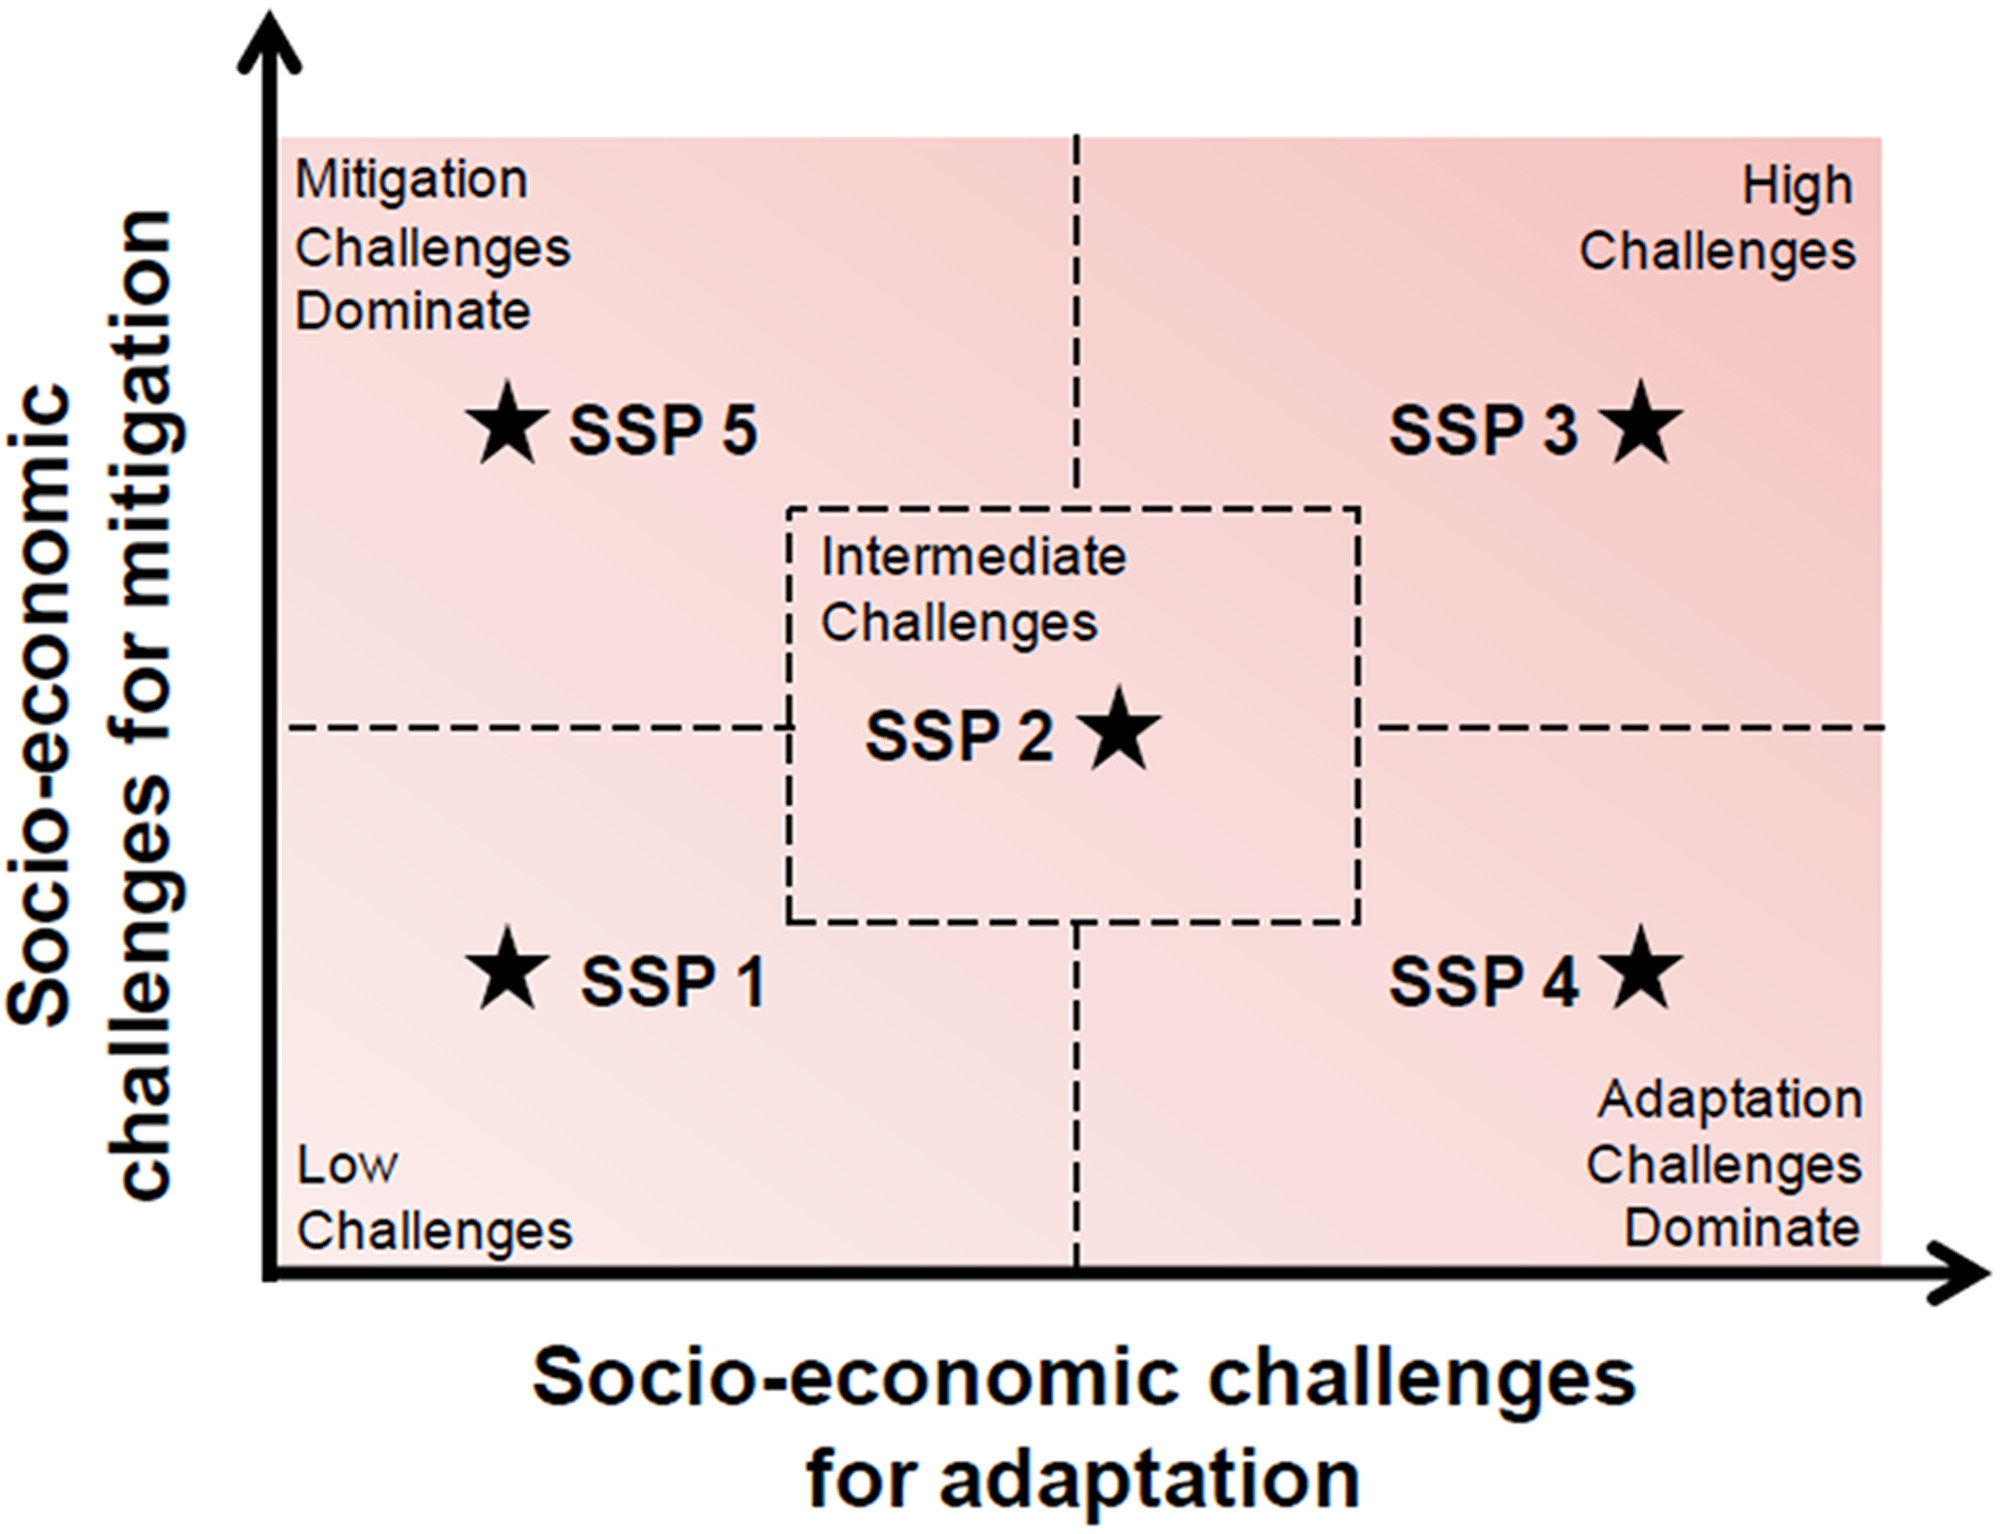
The five SSPs are illustrated via the mapping in the challenges to mitigation/adaptation space:
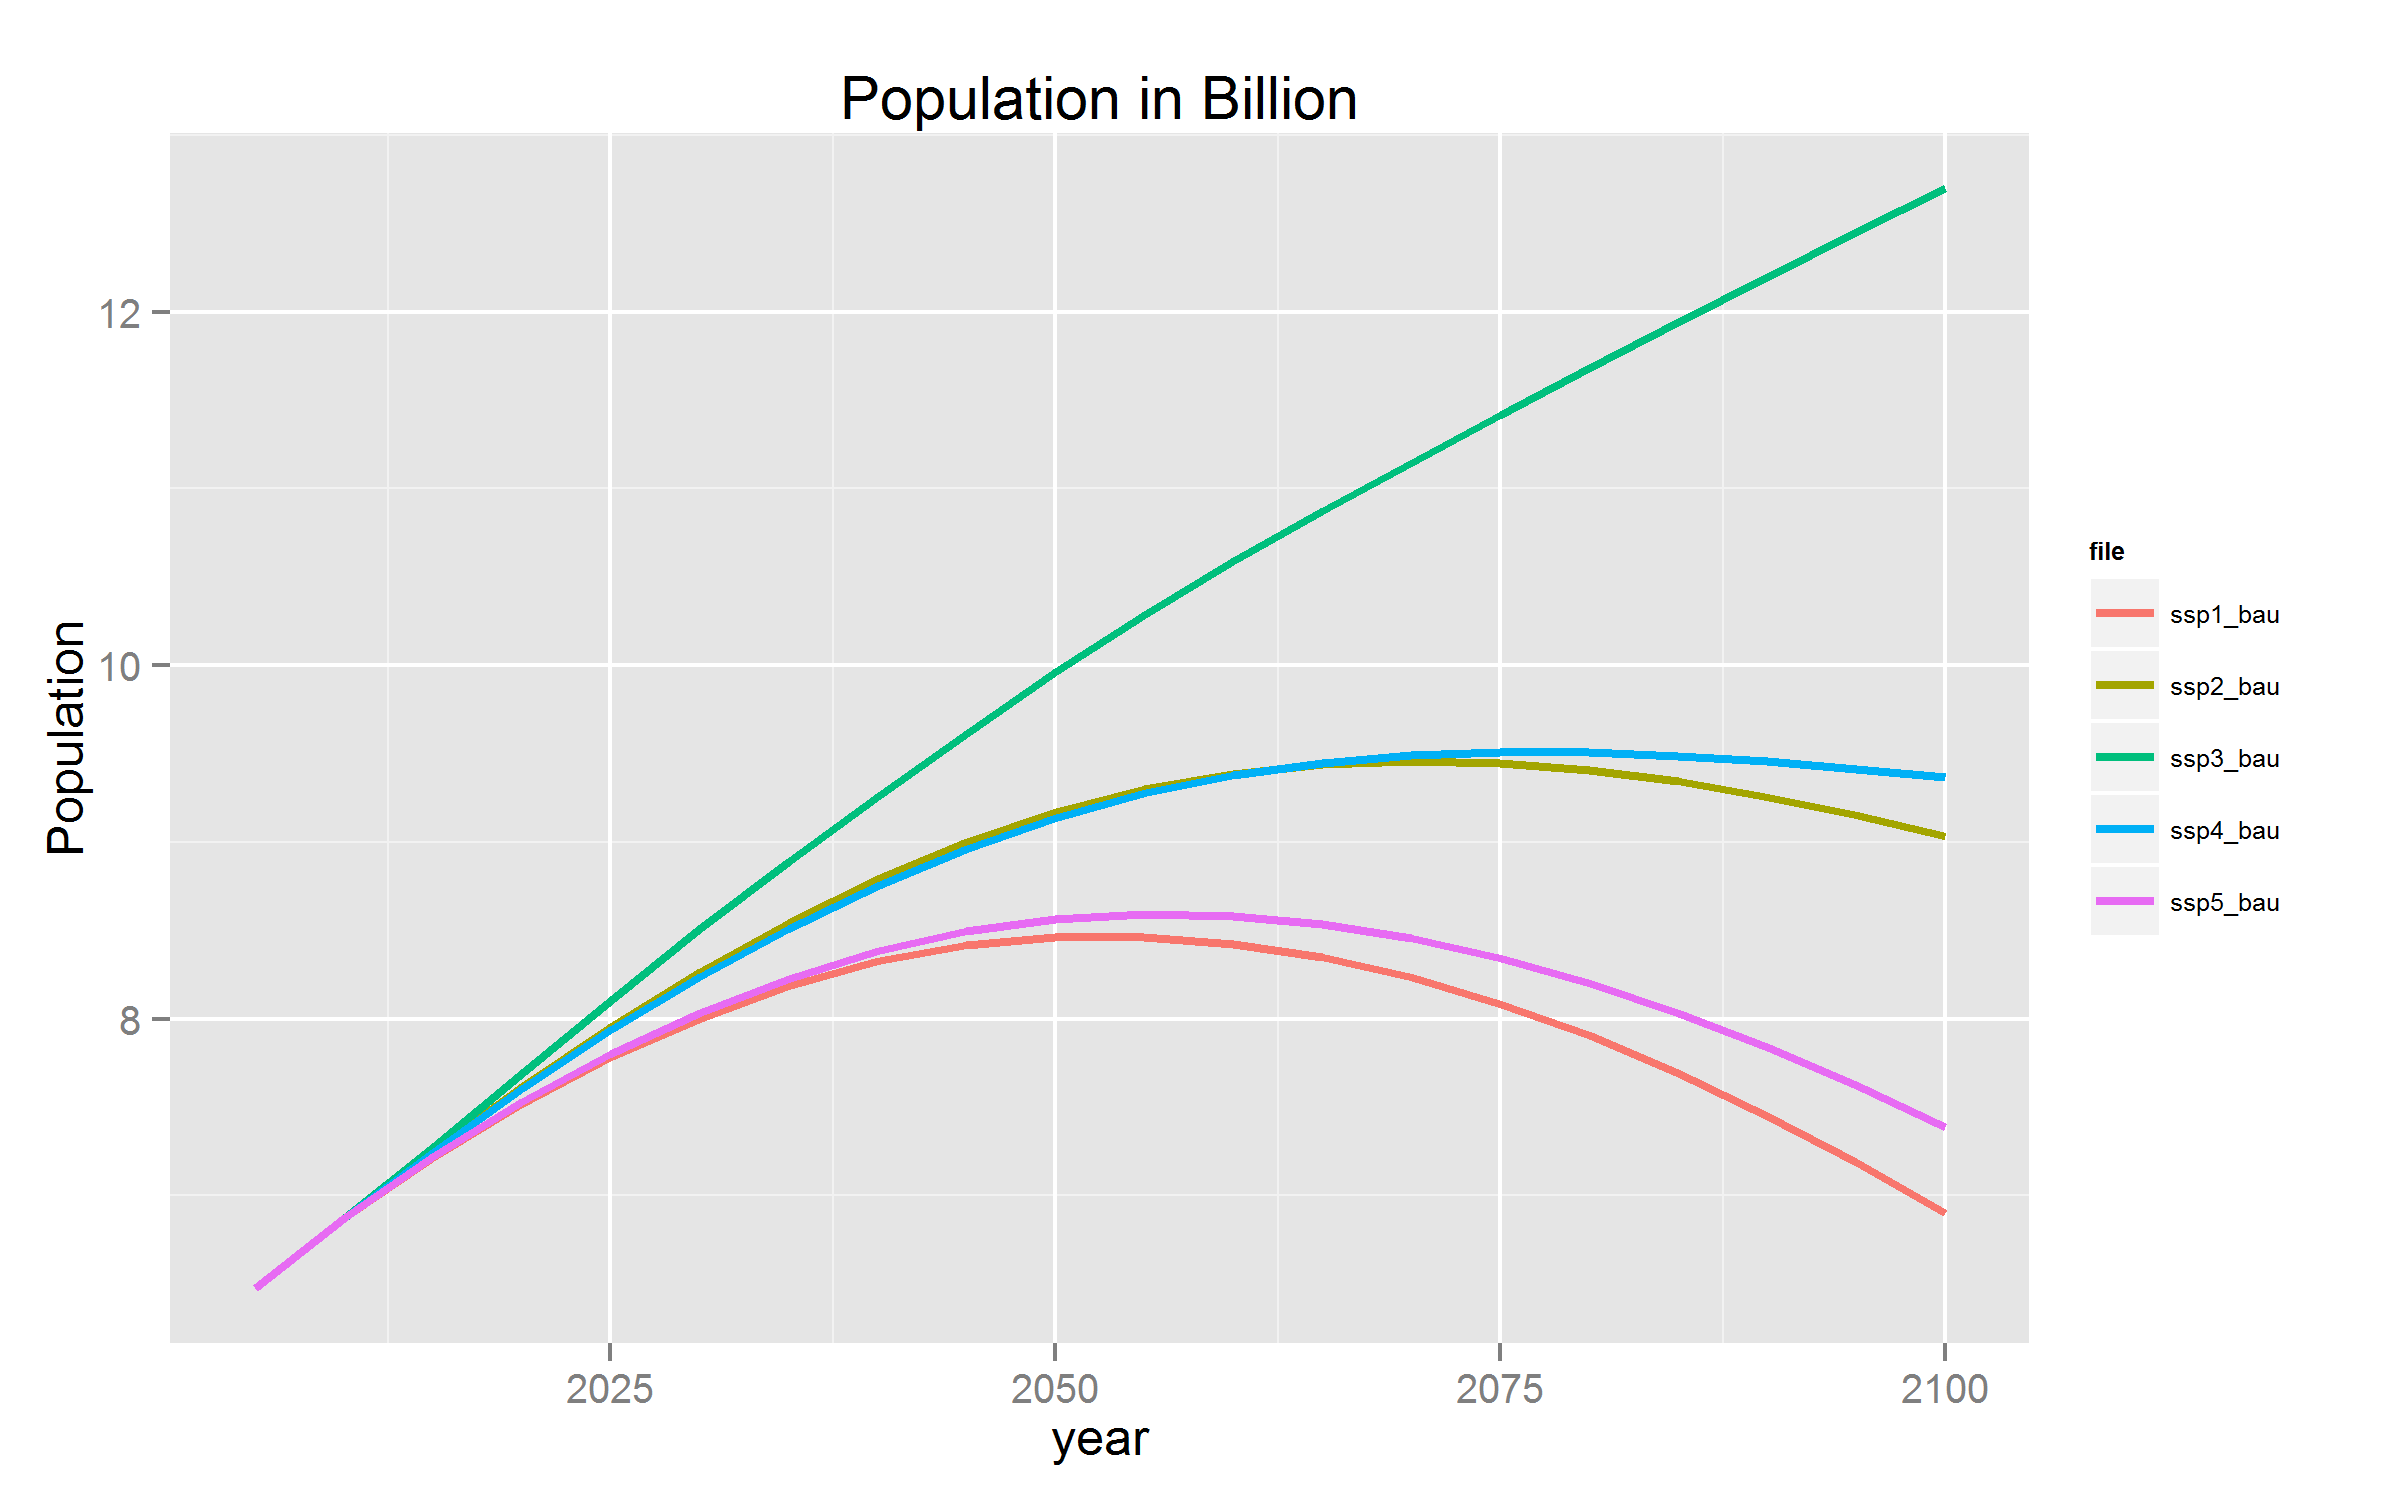
10.1.1 Gross Domestic Product (GDP) and Population
Population forecasts for the different SSPs are based on the common scenarios that have been developed at IIASA (International Institute for Applied Systems Analysis), see (KC and Lutz 2015).
Similarly, GDP baseline projections have been developed and we use the projections made by the OECD (Dellink et al. 2015). These GDP baseline forecasts are implemented using Purchasing Power Parities (PPP) and based on individual countries. We convert the data into USD using market exchange rates using the conversion factor of 2005 (also given by the OECD and assumed constant over time) and aggregate the series into WITCH regions. The GDP projected is then used to calibrate the time series of total factor productivity (‘’tfpy’’) for the model.
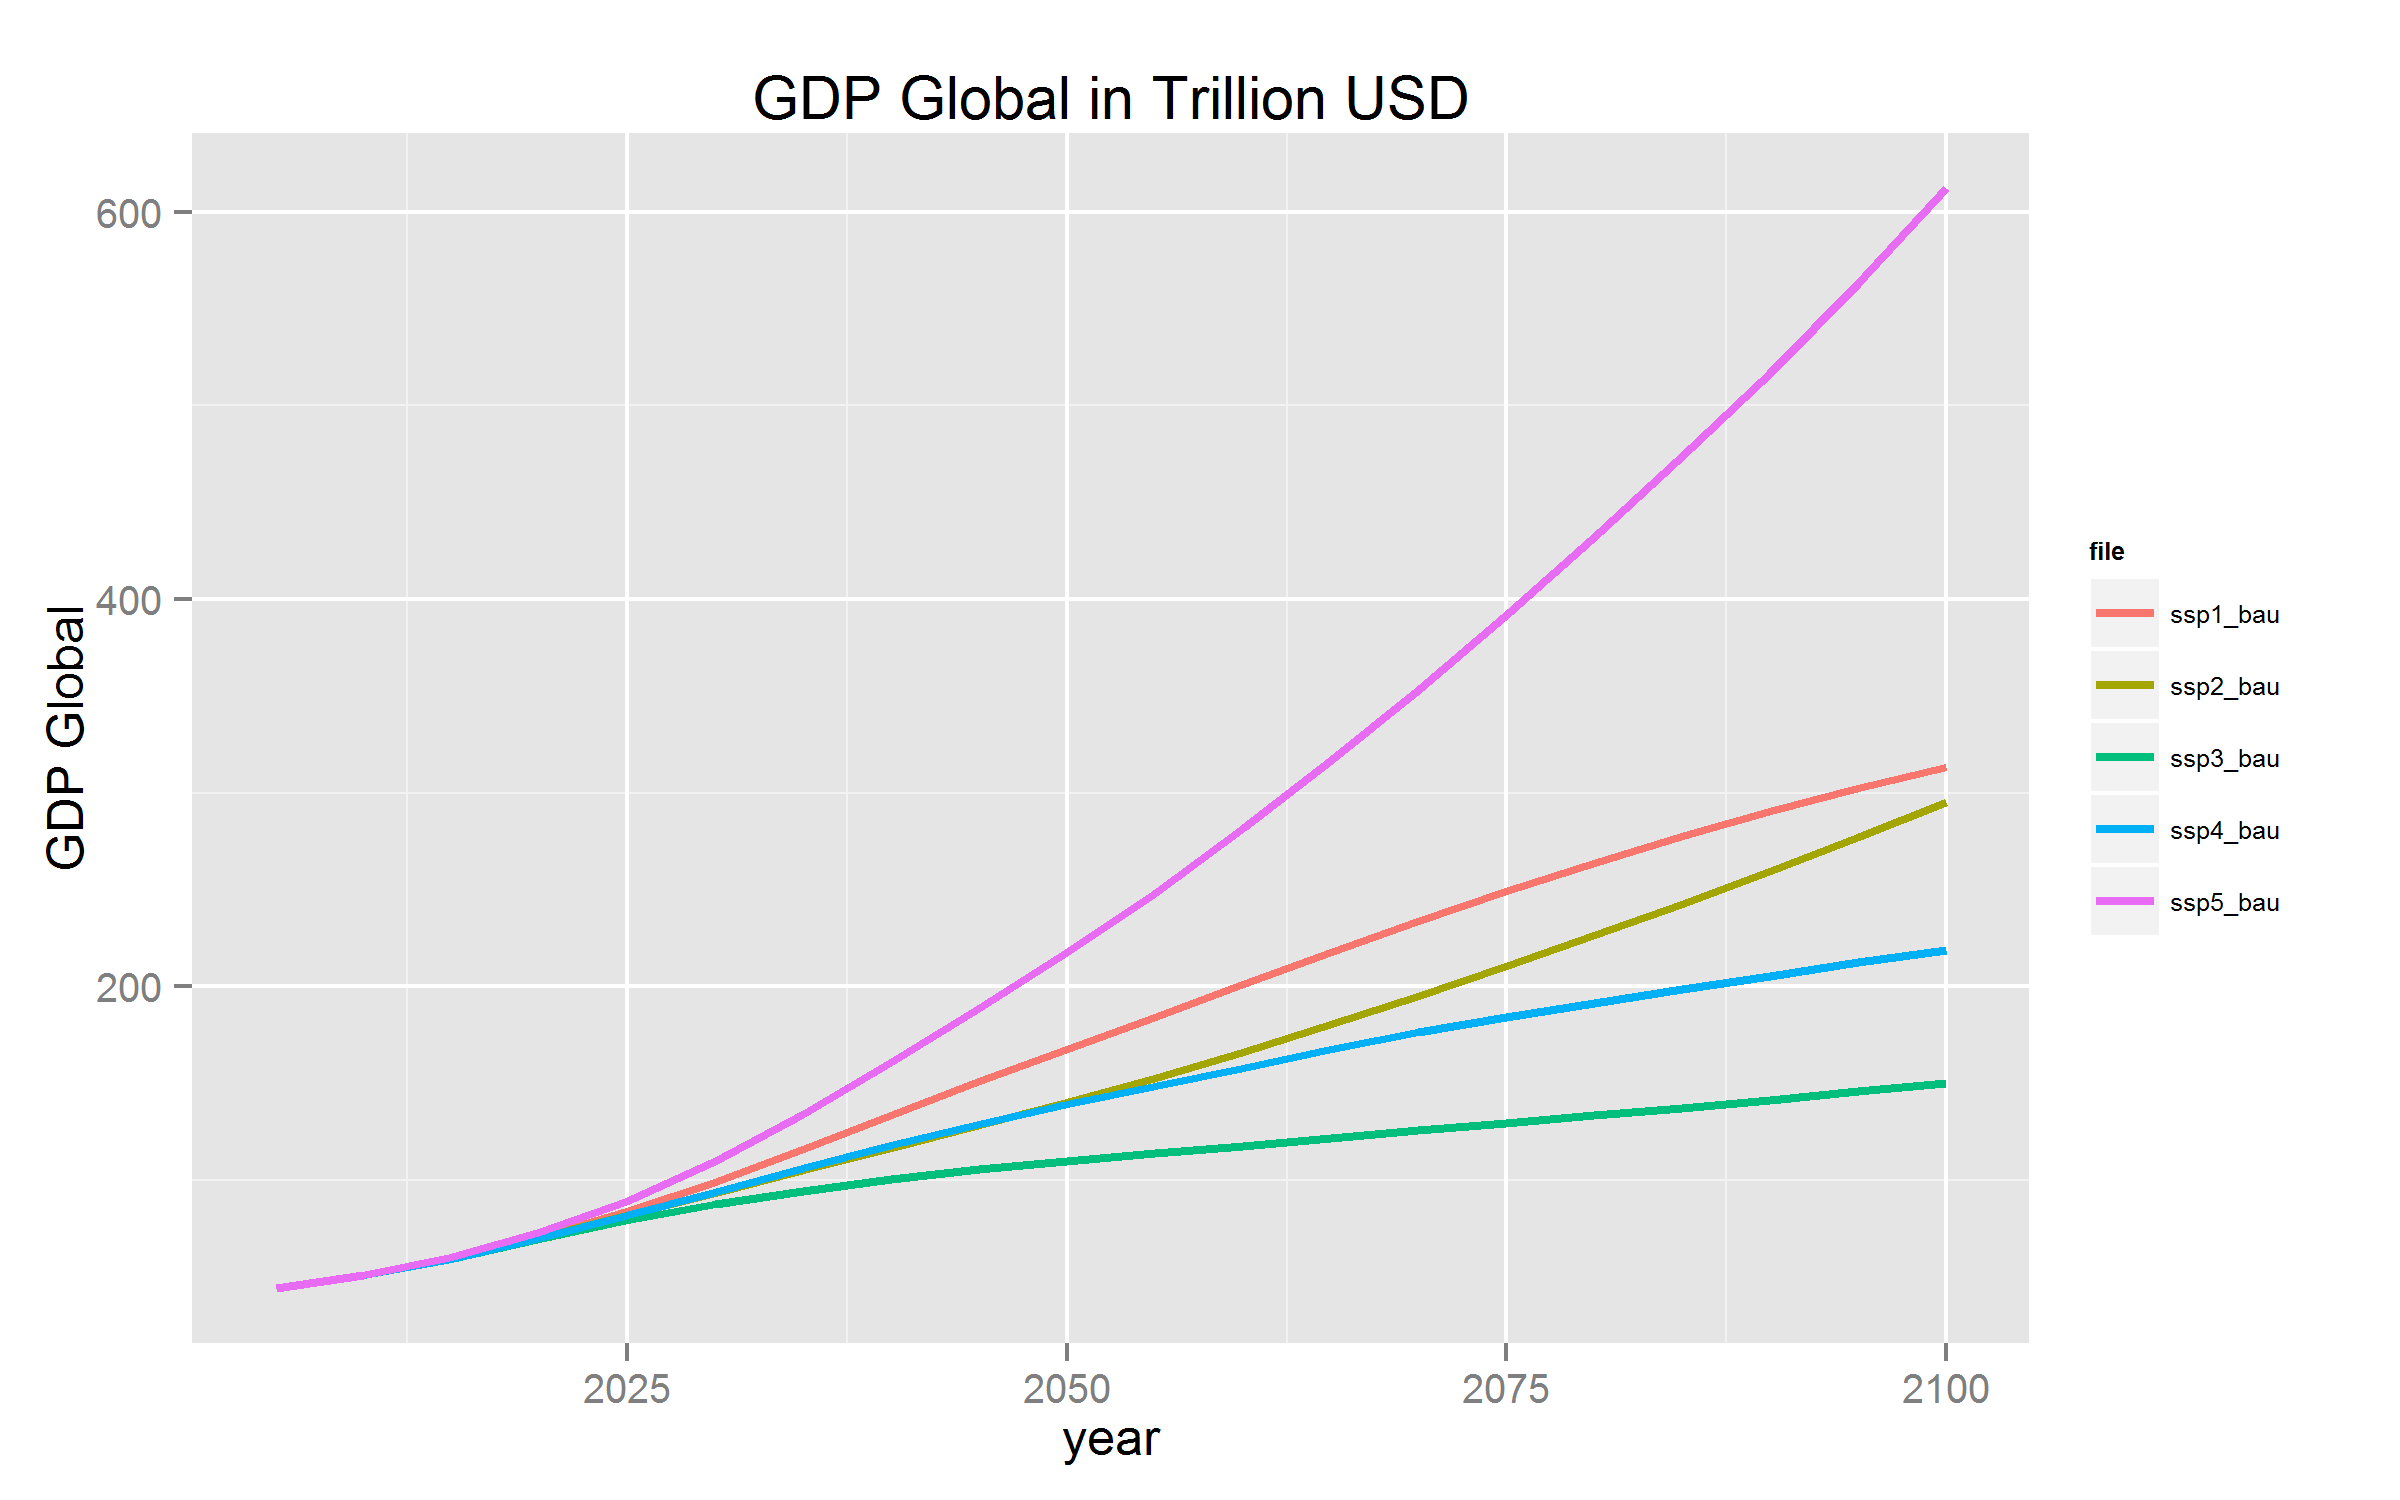
All data series are given until the year 2100. Extrapolations until the time horizon of the models are based on linearly decreasing growth rates starting from 2100 towards zero at the end of the time horizon. All of the baseline data can be accessed at the SSP database. After adding some missing values for 2005 and 2010 and the PPP exchange rate, the total number of countries available from the database is 184.
10.1.2 Energy Intensity
The dynamic calibration of factor productivity of energy services (‘’tfpn’’) is run based on the SSP2. The following income elasticity rule is used for the different regions: industrialized countries (OECD members) are characterized by an elasticity of 0.40 in 2005 whereas non-OECD members have an elasticity of 0.55 based on the higher share of energy expenditures. To take into account economic progress and convergence, the elasticity is assumed to fall exponentially to finally reach a value of 0.2 in the year 2150.
Based on the obtained time series of regional energy productivity changes for SSP2, the same series is used for SSP4, and SSP5. Only for the “sustainable world” SSP1, the series is adjusted increasing the improvement in the factor productivity of energy by 1 percentage point per year to reflect the higher efficiency improvement in this scenario. Similarly, for the SSP3, the improvement is reduced by 1 percentage point per year to take into account slower energy efficiency improvement in this scenario. These values result in reasonable primary energy demand projections for the respective story lines and baseline GDP and population projections.
10.1.3 Land-use
Land-use representation is carried out through a soft linkage with the land-use model GLOBIOM, so the representation of the SSP follows the GLOBIOM implementation. GLOBIOM represents 3 pathways focusing on three narratives that cover a wide range of plausible future developments and that, at the same time, prevent inflation in the number of scenarios under different assumptions on future climate (Representative Concentration Pathways – RCPs) and different Global Circulation Models (GCMs). The three variants consist in: a sustainable intensification scenario with high economic growth, high GDP growth, changing diets and a high degree of technological change (SSP1); a continuation of current trends (SSP2); and a degradation scenario with little technological change, poor economic growth and high population growth (SSP3). The implementation of the SSPs thus follows the implementation in GLOBIOM.
GDP is the main driver for calorie intake per capita and for the fraction of animal products in the total diet. Projections for the three SSPs in terms of food habits were incorporated into the SSPs (Havlik and others, 2012) in the following way. - In SSP1, a convergence (driven by elasticities) towards nutritional targets is considered, using both the IIASA definition and the WHO definition. Income elasticity for calories and animal products rises in developing countries and falls in the United States; - The same rising and falling pattern of elasticities would occur in SSP2 but at a slower pace. GDP convergence tends to make regions converge on diet patterns. This also matches the FAO 2030 projections ; - In SSP3, no convergence to nutritional targets was found, current trends are reinforced by GDP changes with less consumption in developing regions, but higher or stable consumptions in developed regions (same elasticities as in SSP2).
10.1.4 Technology
The following matrix is applied to power technologies in the different SSP scenarios. “Low” indicates low penetration or high costs; “Medium” indicates the baseline assumptions; “High” indicates high penetration or low costs.
| Technology | SSP1 | SSP2 | SSP3 | SSP4 | SSP5 |
|---|---|---|---|---|---|
| CCS | Low | Medium | Medium | Medium (OECD) - High (non-OECD) | High |
| Nuclear | Low | Medium | High (OECD) - Medium (non-OECD) | Medium (OECD) - High (non-OECD) | Medium |
| Renewables | High | Medium | Low | High | Medium |
In the “High” cases, investment costs of CCS and nuclear plants decrease over time by 1%/yr; lower costs of CO2 and waste storage are applied to CCS and nuclear, respectively; concerning renewables, learning rates are increased by 50% and floor costs are reduced by 50%, additionally flexibility coefficients are reduced by 50% and a more relaxed version of the capacity constraint (i.e. without the capacity factor) is applied.
In the “Low” case, the opposite applies (except for learning rates which are decreased by 33%).
10.1.5 Personal transport
The following matrix is applied to the different SSP scenarios in the transport sector.
| Quantity | SSP1 | SSP2 | SSP3 | SSP4 | SSP5 |
|---|---|---|---|---|---|
| Vehicle number | Low | Medium | High | High | Medium |
| Travel intensity | Low | Medium | High | High | Medium |
| Fuel efficiency improvement rate | High | Medium | Low | High (OECD) - Low (non-OECD) | Low |
| Battery learning progress factor | High | Medium | Low | High | Low |
Vehicle number: OGE is multiplied by 0.8 in the Low cases, by 1.2 in the High cases;
Travel intensity: it decreases by 1%/5yr from 2015 in the Low cases, the opposite in the High cases;
Fuel efficiency improvement rate: it is -0.25 by default; it is multiplied by 3/2 in the High cases, by 4/5 on the Low cases;
Battery learning rate: it is 0.144 by default; it is multiplied by 5/4 in the High cases, by 2/3 in the Low cases.
10.1.6 Air pollutant emissions
SSP are implemented under the form of a set of air quality emission factors following the SSP narratives for air pollution.
For the SSP implementation the countries are classified according to the their income, (income categories in fig.1.) and their emission factor path is computed. The countries are then regrouped by the WITCH regions, performing a weighted mean according to their GDP.
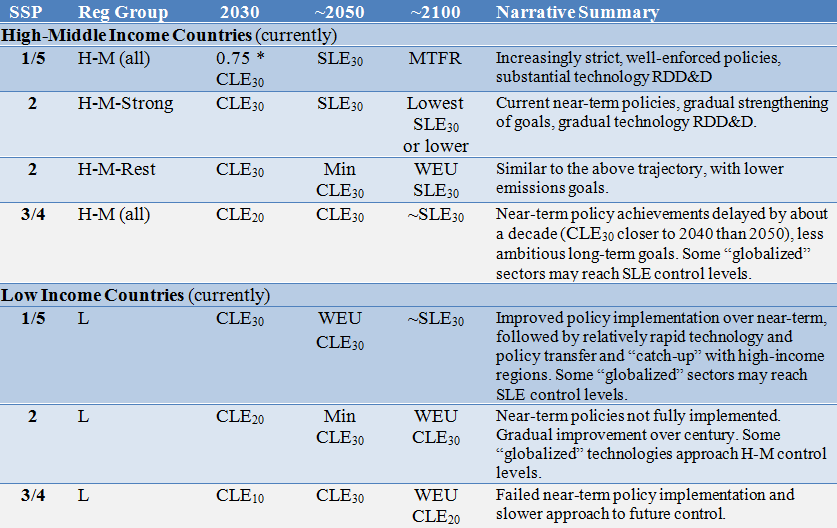
The [SSP income categories and pathways] Figure shows the implementation of the emission factor pathways witch depends on SSP and on income group. There are 3 emission factor pathways, SSP 1 and 5 and SSP3 and 4 share the same narratives in terms of air pollution although their energy, technology and economic baseline assumptions will necessarily lead to different emission profiles.
10.1.7 Fossil Fuel Resources
The fossil fuel supply curves are taken from the ROSE project, which developed High/Medium/Low supply curves for oil, coal, and gas reserves, see the depicted global curve in the chapter on Fossil fuel resources.
| SSP | Oil | Gas | Coal |
|---|---|---|---|
| SSP1 | Low | Low | Low |
| SSP2 | Medium | Medium | Medium |
| SSP3 | High | High | High |
| SSP4 | Low | Medium | Medium |
| SSP5 | Low | High | High |
10.1.8 Adaptation
The table below describes the implementation of adaptation across SSPs in the WITCH model. We assume that slow development, low investments in human capital and technology, increased inequality, and bad institutions in SSP3 reduce the effectiveness of adaptation actions, whereas the more optimistic institutional and growth set-up of SSP5 increases adaptation effectiveness. We assume that a dollar invested in proactive or reactive adaptation in SSP5 and SSP1 is 25% more effective at reducing damage than in SSP2 (the marginal productivity of these actions is assumed to be 25% higher). Symmetrically, a dollar invested in adaptation in SSP3 and SSP4 is 25% less effective at reducing damage than in SSP2. Moreover, the WITCH model links the growth of generic adaptive capacity to GDP growth, which varies across SSPs.
| SSP1/SSP5 | SSP2 | SSP3/SSP4 | |
|---|---|---|---|
| Adaptation | Low challenges due to rapid development, formation of human capital, reduced inequality | Intermediate challenges | High challenges due to slow development, low investments in human capital and technology, increased inequality, weak institutions |
| Efficacy | High | Medium | Low |
| Productivity of adaptation \(\omega_{eff}(n)\) | 1.25 | 1.00 | 0.75 |